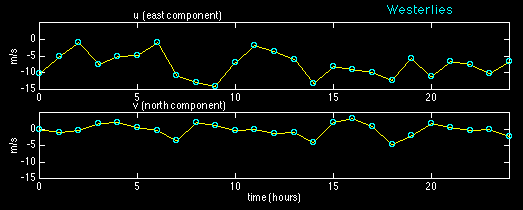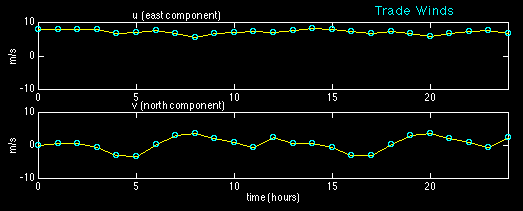
Displaying east-west and north-south components is another way of showing wind observations. (The full range of display methods for vector properties such as wind is discussed in Exercise 2: "Graphic display methods for ocean currents".) Again, the top diagram displays the model Trade Wind data, the bottom diagram the model Westerlies. Because both the Trade Winds and the Westerlies are mainly zonal, the east-west component u is usually larger than the north-south component v. Positive u means the wind is coming from the east; positive v means it is coming from the north. Note the difference in scales.
Make a note of what you estimate to be the mean wind velocity components for both sets, for comparision with later calculations.

