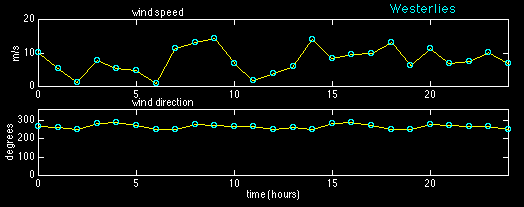
The Westerlies are highly variable winds with moderate mean speed but frequent storms. The model data reflect this by showing a wind speed which varies between 2 and 15 m s-1 and a wind direction around the 270° mark:

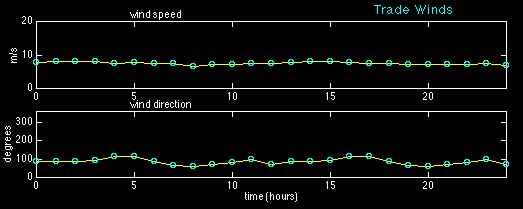
The Trade Winds are of moderate to high mean speed but lack the bursts of storm winds found in other wind systems. The model data reflect this by showing a wind speed of about 5 - 8 m s-1 and a wind direction around the 90° mark:

The diagrams shows the wind speed in m/s and wind direction in degrees for the model Trade Wind data and for the model Westerlies, assuming that we measure wind speed and direction every hour for two days. Note that winds are always displayed in meteorological notation, which gives the direction from where the wind is blowing. (In contrast, ocean currents are always given in oceanographic notation, which shows direction where the current is going.)
Compare the two data sets. Make a note of what you estimate to be the mean wind speeds and the mean wind directions for both sets. We will calculate these and other quantities later, so you can verify your estimates against calculated values.