| record number |
time (UTC) | east component u (m s-1) |
north component v (m s-1) |
 |
| 1 | 08:25 | 0.2 | 0.1 | |
| 2 | 09:25 | 0.1 | 0.2 | |
| 3 | 10:25 | -0.2 | 0.1 | |
| 4 | 11:25 | 0.0 | -0.2 |
A common method of recording water movement is the use of moored current meters. This is an Eulerian measurement. However, the Lagrangian way of following the movement of water parcels is often more illuminating than looking at records of current speed and direction, or at current components. The progressive vector diagram was devised to simulate a Lagrangian display from Eulerian measurements.
Let us assume that a current meter is placed on a mooring. It averages the current over one hour and records the hourly averages. The following table gives the first four readings from such a record.
| record number |
time (UTC) | east component u (m s-1) |
north component v (m s-1) |
 |
| 1 | 08:25 | 0.2 | 0.1 | |
| 2 | 09:25 | 0.1 | 0.2 | |
| 3 | 10:25 | -0.2 | 0.1 | |
| 4 | 11:25 | 0.0 | -0.2 |
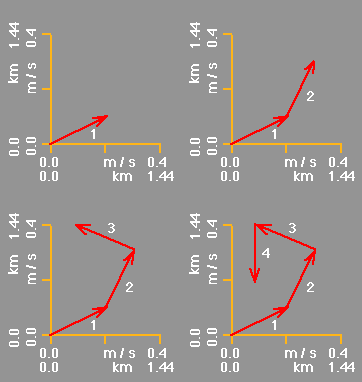
The progressive vector diagram is constructed by drawing the first current vector in a Cartesian co-ordinate grid. The second vector is than added to the first vector, its tail sitting on the head of the first vector, and so on, as shown in the diagram. The x- and y-axis, which are in velocity units (m s-1), are converted to space units (m or km) by noting that a water parcel travelling at 1 m s-1 for 1 hour will have covered a distance of 1 m s-1 times 3600 s, or 3.6 km. (Thus, a velocity of 0.4 m s-1 over a 1 hour interval corresponds to a distance of 0.4 times 3600 = 1440 m.)
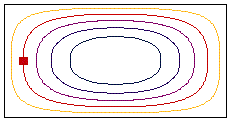
The resulting diagram shows how the water parcel would have moved if the current would be the same wherever the particle went. There is obviously no guarantee that this is always the case. Take, for example, the case of the steady movement in a rectangular basin from our previous example. The diagram below shows it again, with streamlines in different colours.
If we place a current meter at the location identified by the red square in the diagram below, the current meter will always indicate exactly northward flow at that location, while a water parcel will follow a streamline. After some time, the progressive vector diagram will not indicate the parcel's movement at all. What do you think will happen?
