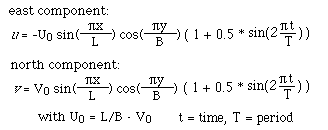
We can take the example of the rectangular basin as a miniature version of an ocean basin in the subtropics of the northern hemisphere (without Coriolis force). The streamlines which we saw were then the trajectories of water moving in a subtropical gyre in steady motion.
Let us now assume that the gyre is not in a steady state but speeds up and slows down in response to seasonal variations in wind strength. The current, and as a consequence the streamfunction, are then functions of time.
We assume a periodic increase and decrease around a mean value (which might represent a speeding up of the gyre during winter when winds are strong and a slowing down during summer when winds are light).
We assume the same velocity components as before but make them time-dependent:

With the given time-dependent velocity components ψ becomes

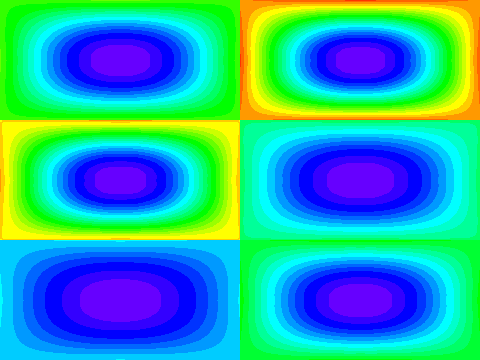
 Streamlines are defined as lines of constant streamfunction. If the streamfunction varies
with time, the positions of the streamlines vary with time. The animation
demonstrates this by displaying streamfunction values as colour patterns. The start of
the time sequence corresponds to the mean situation, which is identical to the
streamfunction field of the steady state seen before.
Obviously, the movement of water does not follow the pulsating movement of the streamlines. Water particles will still follow the same path as in the steady state but will move faster during one part of the cycle and slower during the other part.
In summary, this demonstration of streamlines as Lagrangian indicators of water movement shows that
Streamlines are trajectories only under conditions of steady flow. |
A true Lagrangian description of oceanic currents can only be achieved by placing a drifting object in the ocean and plotting its position with time. This is not a vector plot in its strict sense, since positions are given by a single pair of x and y co-ordinates and not by a magnitude and a direction. (The magnitude and direction of the current are only determined by the sequence of positions.) Position plotting will therefore not be discussed in this exercise.