11. Scientific basis and Plans for XBT network in the Indian Ocean
V.V.Gopalakrishna - National Institute of Oceanography, Dona Paula, Goa-403004, India
G .Meyers - CSIRO, Marine Laboratories, Hobart, TAS, Australia
1. Introduction
Indian Ocean (IO), a unique ocean in several aspects, is sparsely sampled compared to other oceans. This ocean has attracted more attention due to its global impacts through Monsoon and Indian Ocean Dipole (IOD) and several regional features that are important for the surrounding climate (Saji et al., 1999; Webster et al., 1999; Ashok et al., 2001; Rao et al., 2002a; Schott and McCreary, 2002 and references therein). With in the IO, the subsurface information is very sparse compared to the surface (Fig.1) and the first ever known expedition in the IO, IIOE started as early as 1961. However, availability of subsurface temperature at regular intervals started only after launching of TOGA program. Under the auspice of TOGA/WOCE and several other regional programs, temperature in the upper ocean has been collected along about 27 XBT lines in the IO (Fig. 1, top left panel) on a regular basis.
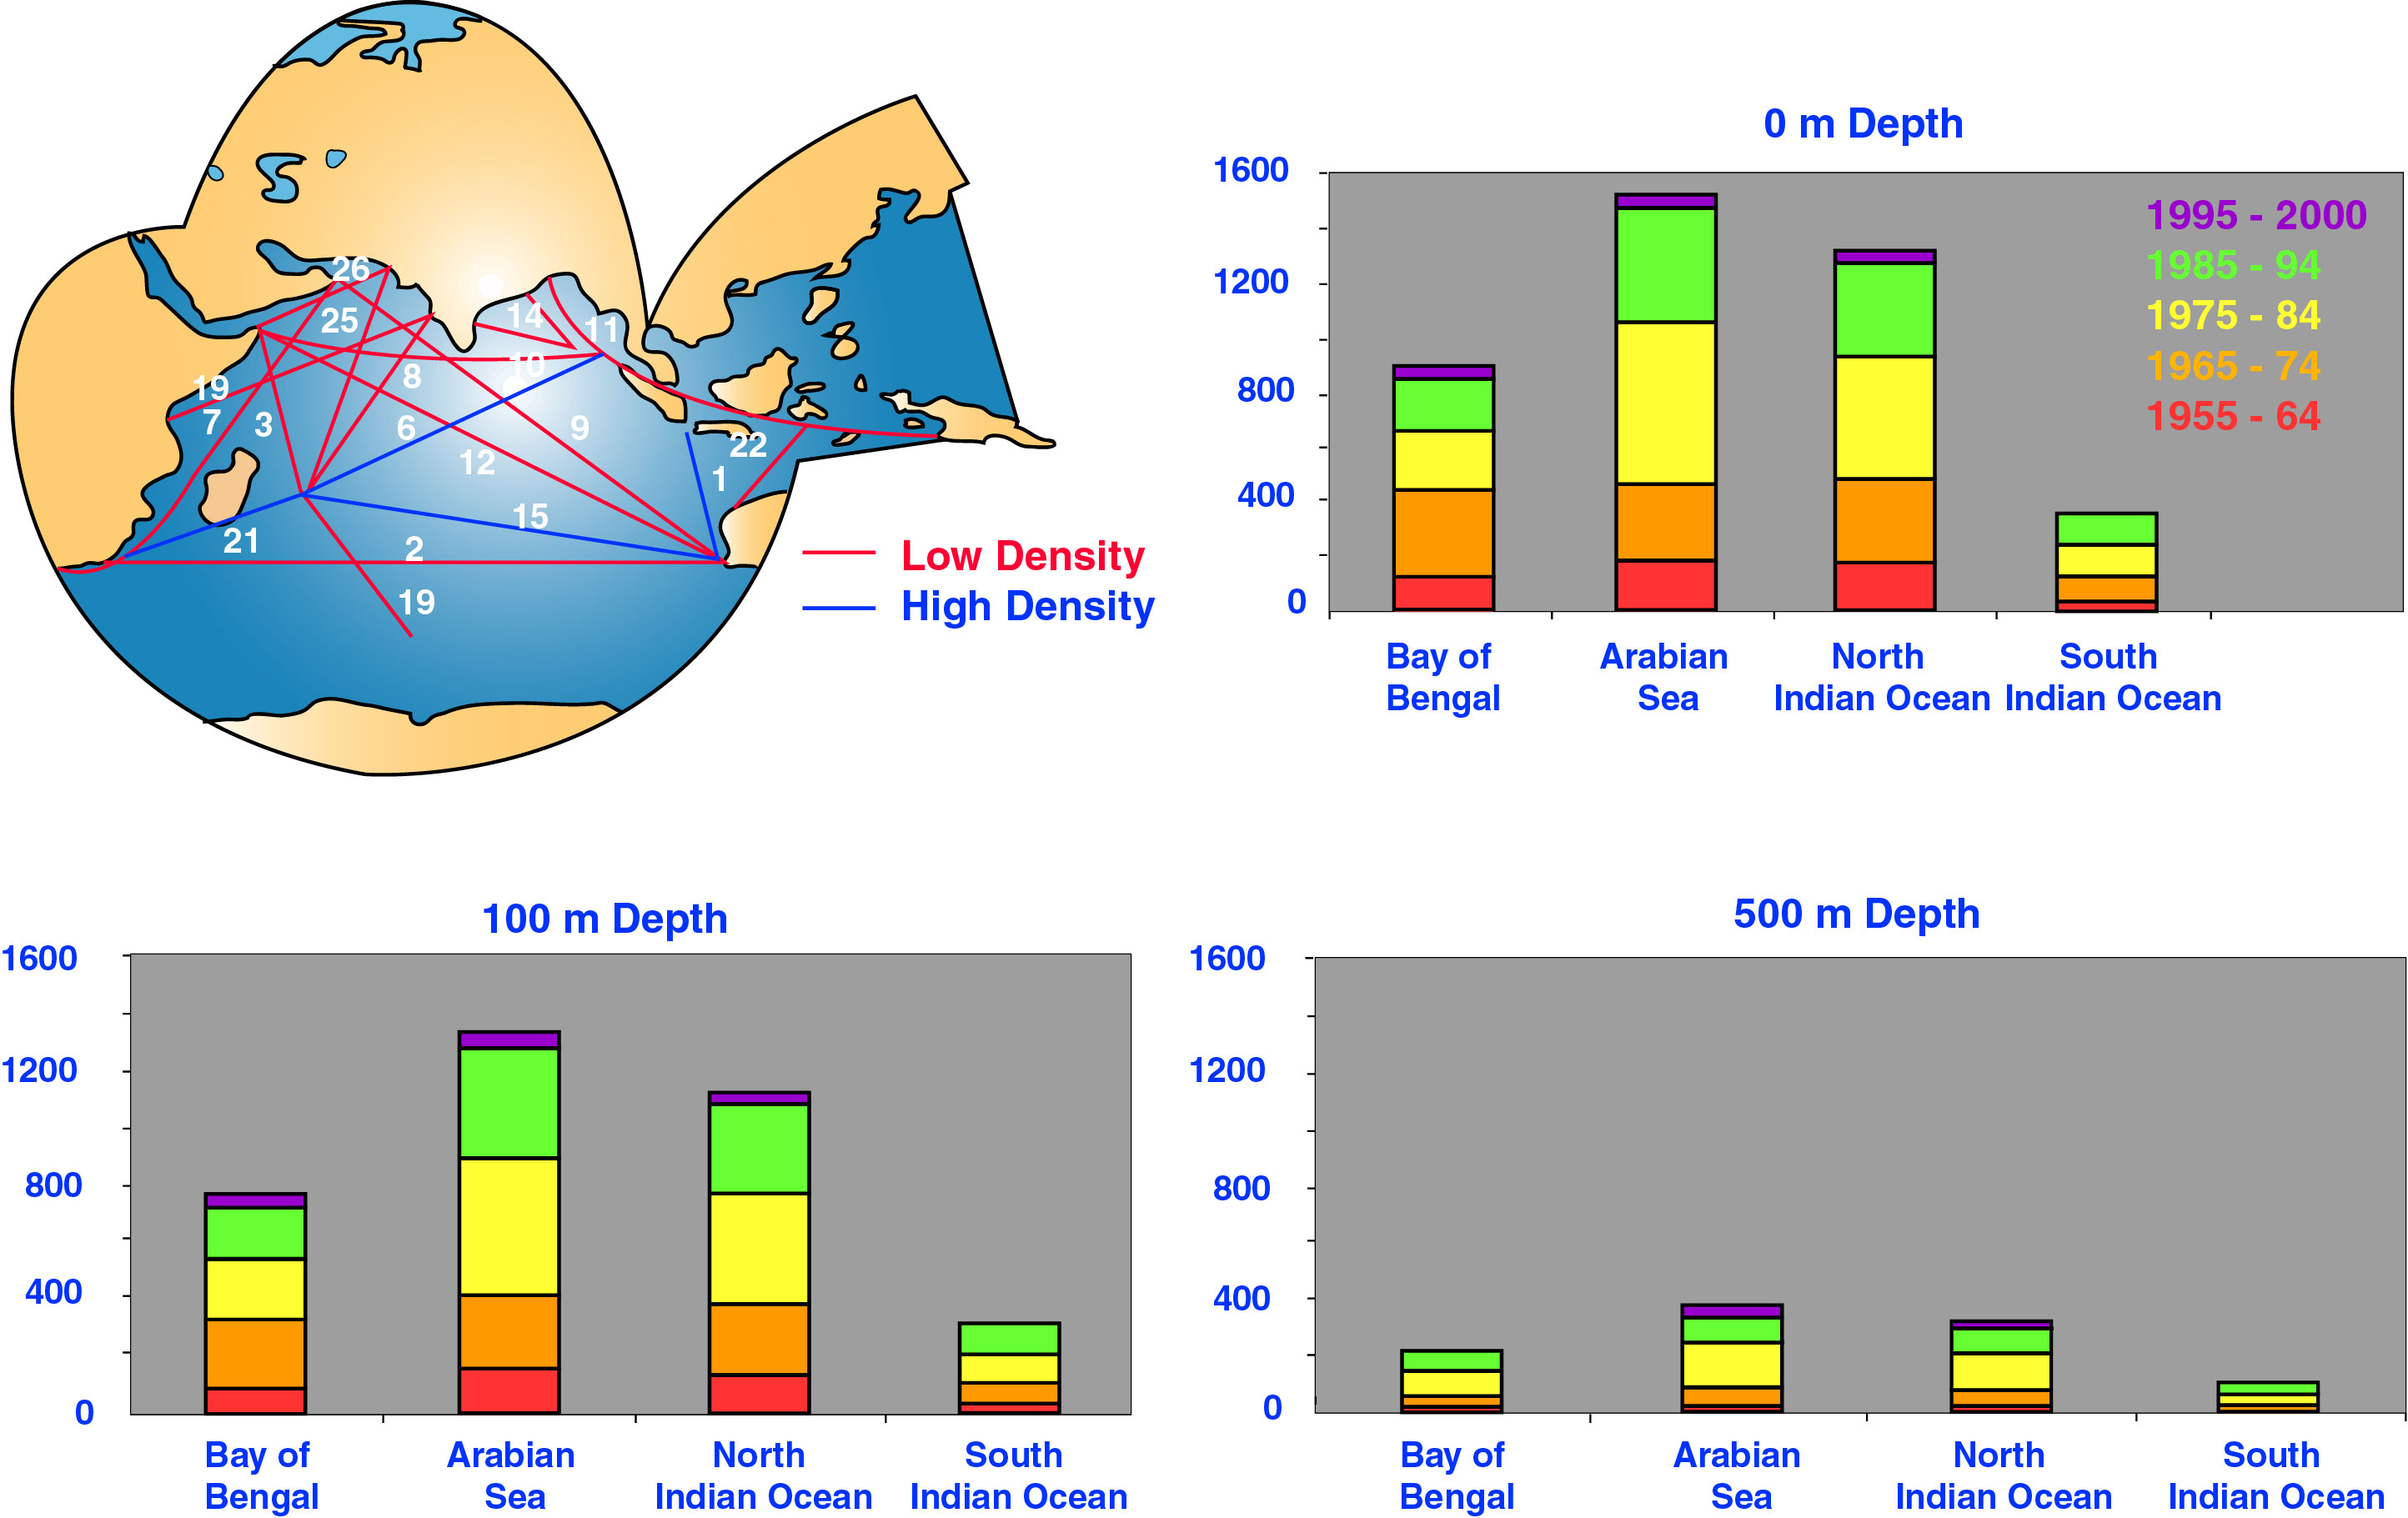
Figure 1.XBT network in the Indian Ocean (top left ), histogram showing the decadal temperature data distribution for different basins of the IO at 0 m (top right), 100m (bottom left) and at 500m (bottom right).
Majority of the nations organize XBT data collection onboard ships of opportunity with the help of ship personnel except India where scientific observers deploy XBTs. Although the number of observations during TOGA decade (1985-94) do not show any significant Histogram is prepared after normalizing the total number of thermal data points against 100 x 100 latitudinal area for different basin increase compared to previous decade (Fig.1b,c,d), However a systematic observational XBT network was established during TOGA decade. Instead of onetime observations at random locations that are of interest to a particular group of scientists, this net work observations and these lines helped to gain a clear understanding of annual and interannual signals in the IO which is the primary basis for the XBT network in the IO. Following are some important scientific studies that are emerged in this direction from the analysis carried out of using XBT data.
2. Scientific achievements from XBTdata analysis
Annual signals:
The temperature observations available in the IO prior to TOGA decade were not even sufficient enough to describe the mean annual cycle in the IO. For example in the Bay of Bengal the mean annual cycle in from Levitus and Boyer (1994) (LB94) temperature climatology is not sufficiently resolved at many places, particularly the eastern and western Bay of Bengal. Combining all the available historic temperature profiles including the observations from Indian TOGA program (13,000 profiles retained after quality controlling from different data sources) (13000 profiles retained after quality controlling) from different data sources, Rao (1998) prepared a a new temperature climatology (NC) for the North Indian Ocean (but published only for the Bay of Bengal). Comparison of horizontal temperature distribution maps at 100m depth (dots in each map indicate data density) for July and December (Fig.2) indicates large differences between LB94 and NC. The differences are so high that they are much stronger than the annual signal itself. These observed artifacts reconfirm the absolute necessity for having sustained temperature network in the IO. Donguy and Meyers (1995) are the first one to provide the quantitative estimates, and annual cycle of transports associated with major current systems in the IO. They utilized the XBT data along different XBT lines and used TS relationship to make these estimates. Murty et al (2000) have documented the seasonal variability of upper layer geostrophic transport in the tropical IO using XBT data collected under the Indian XBT program. Both these studies bring out, quantitatively, the seasonal changes in the transports associated with the monsoon.
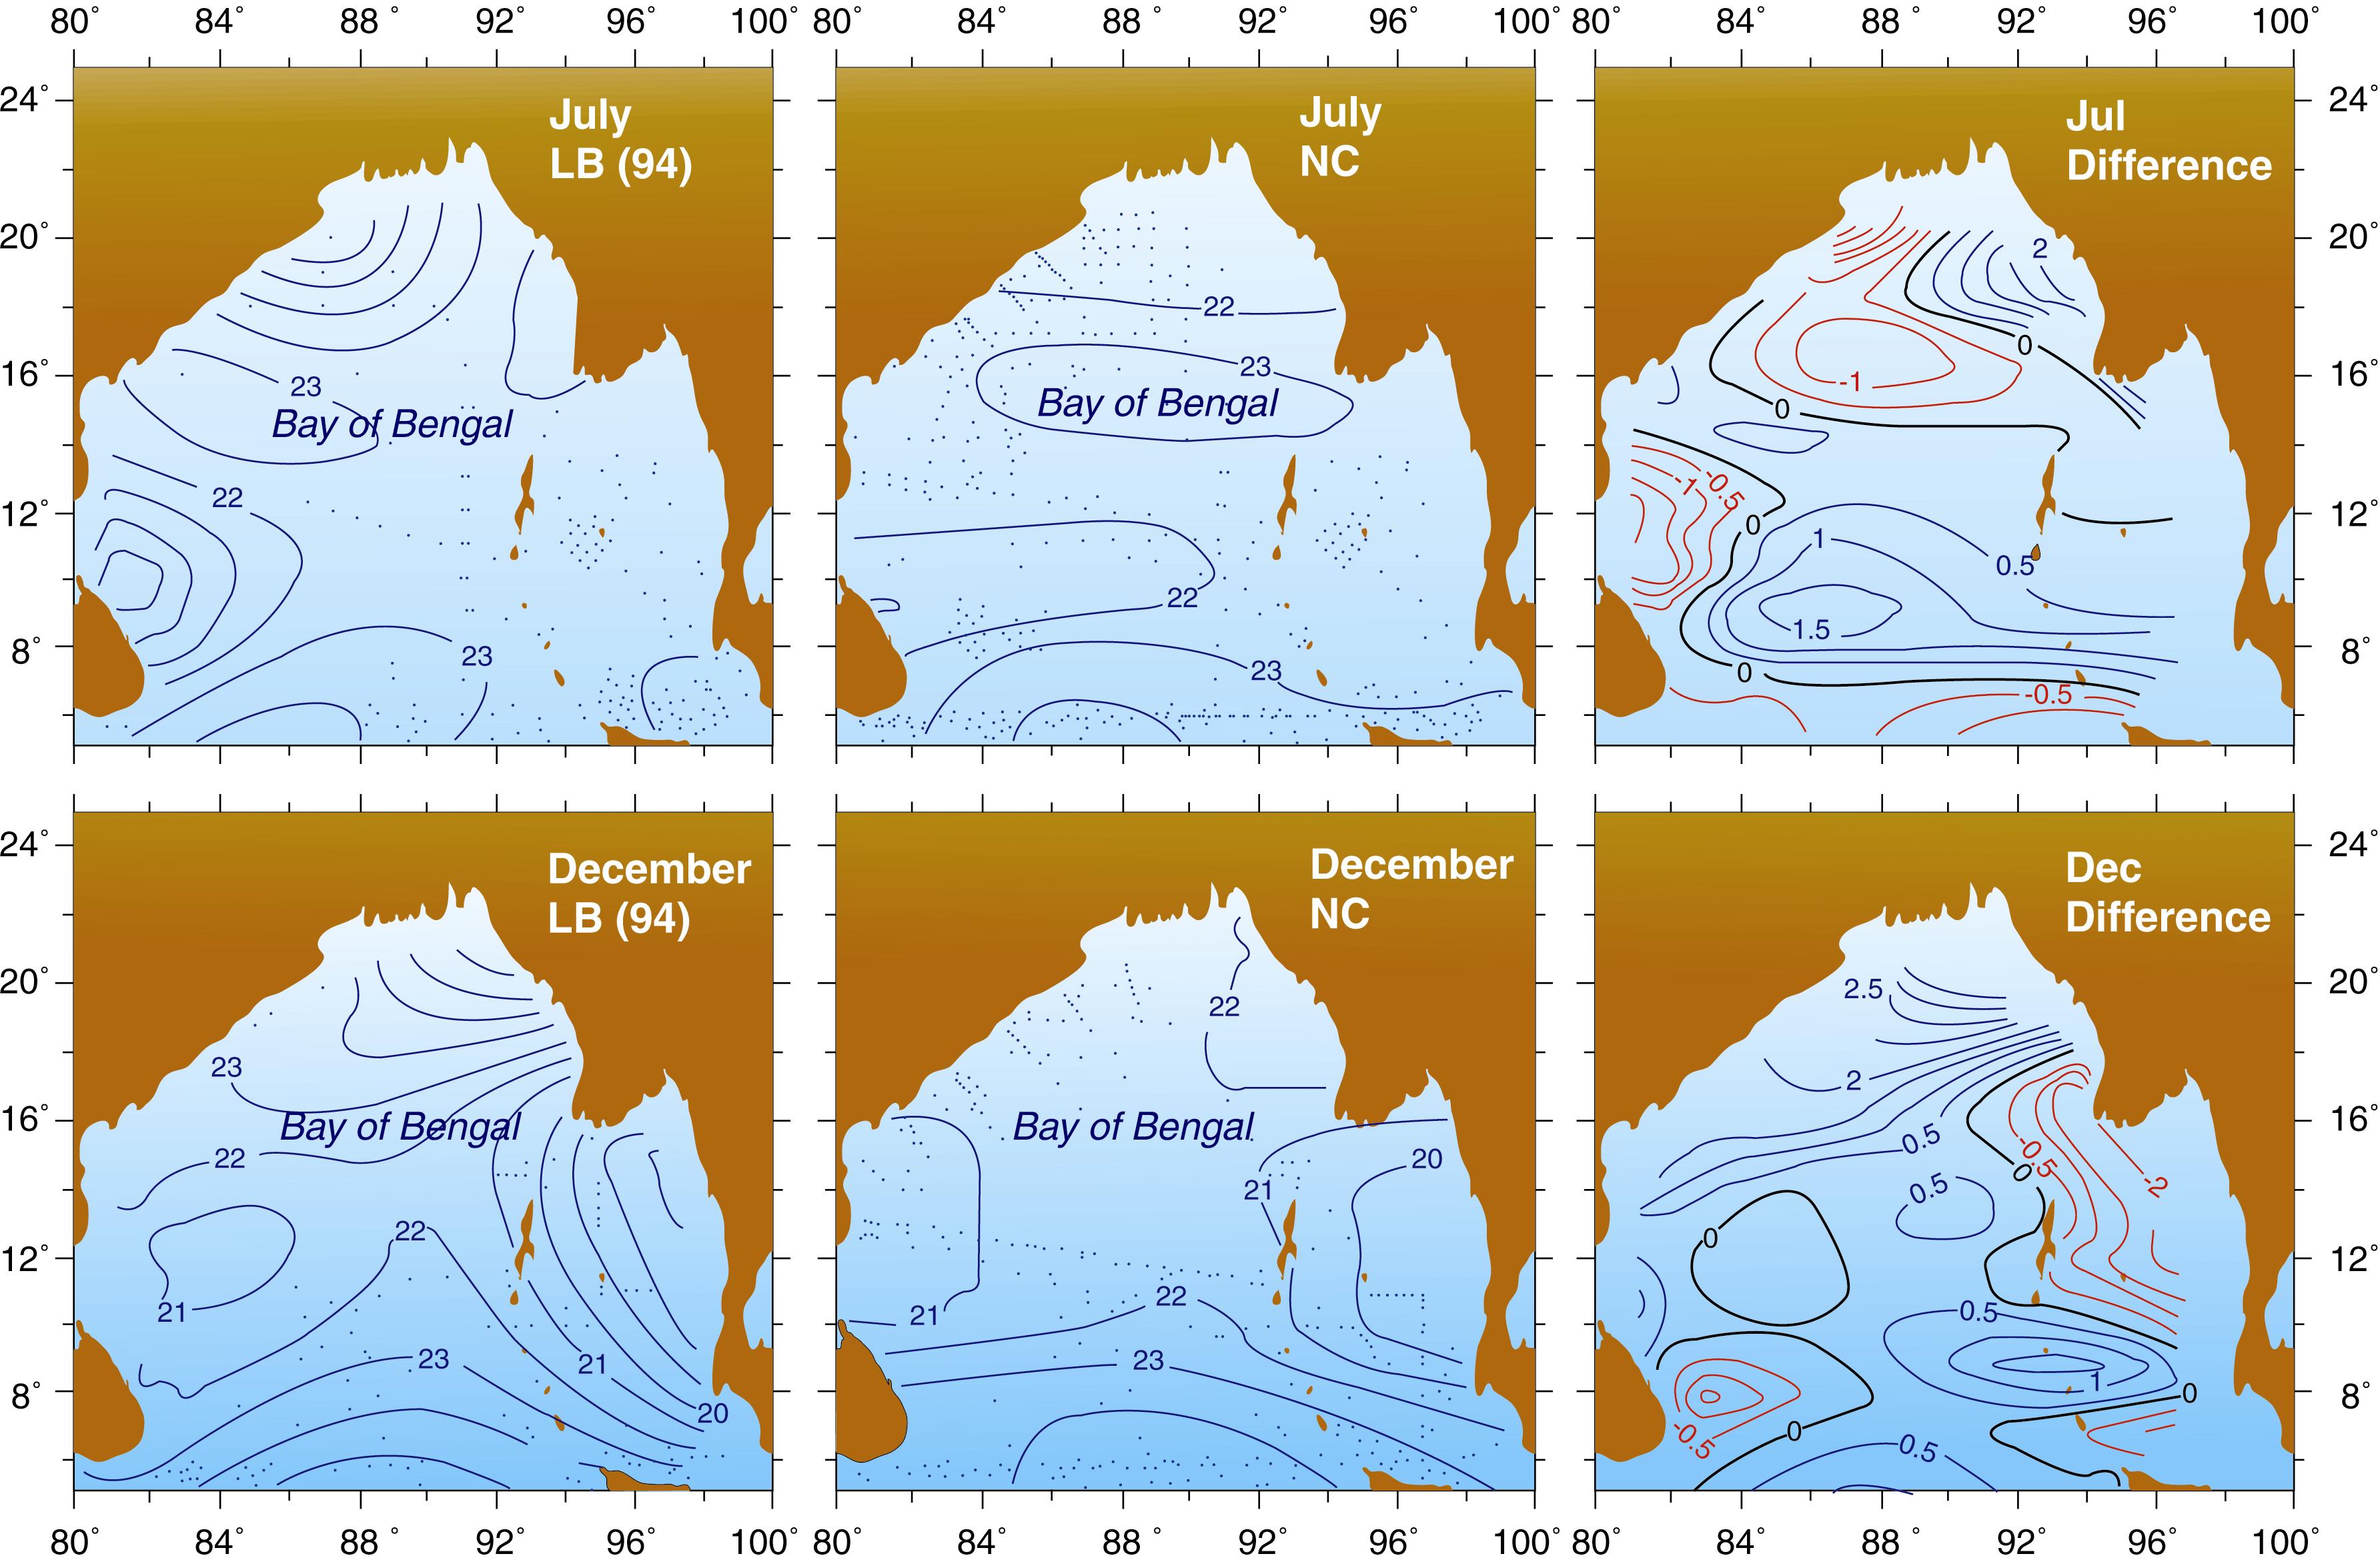
Fig 2: Temperature distribution at 100m depth for LB94 (left panels), NC (middle panels) and differences between LB94 and NC (right panel during July and December.
XBT data usefulness to define the mean annual cycle of temperature and transports is also extended in identifying and verifying the theoretical explanation of forcing mechanisms of the IO circulation. Masumoto and Meyers (1998) and Rao (1998) identified Rossby wave signals, which are believed to be major players in controlling the circulation in the IO (Woodbery et al., 1989; McCreary et al., 1993), from XBT data in the southern IO and Bay of Bengal respectively. Annual Rossby waves are found to be the dominant signals in Southern Indian Ocean, while Annual and semi-annual Rossby waves are found to be equally dominant in the Bay of Bengal.
Interannual Signal
Well before the identification of the coupled air-sea phenomenon in the IO (Indian Ocean Dipole) (Saji et al., 1999 and Webster et al., 1999), Meyers (1996) and Masumoto and Meyers (1998), using XBT data, identified a sea-saw oscillation in the thermocline depths between eastern and western tropical IO (Fig. 3) and raised the issue that part of this interannual sea-saw can be explained by zonal winds in the equatorial Indian Ocean (Meyers, 1996). Further Ming et al., (2001), Rao et al., (2002a) and Ming and Meyers (2002) showed that these thermocline oscillations are in fact due to the IO Dipole and the quasi-biennial nature of this coupled phenomenon arises due to the subsurface dynamics brought out clearly by Rao et al. (2002a) using MBT/XBT observations for the last 50 years at different locations in the IO. Interannual variability of the Indonesian through flow transports and its association with the IO was highlighted by Meyers (1996).

Figure 3.EOF loadings for sea level anomalies (top panel) and temperature anomaly along the two XBT sections (lower panel). The locations of the XBT sections are denoted with black dots in the…?
Masumoto and Meyers (1998) also identified the interannual Rossby waves in the Southern IO from XBT data and OGCM results. Recently, Xie et al (2002) identified a thermocline ridge in the SIO and suggested that the interannual variations in this ridge have significant implications on the climate variability in the surrounding regions and also on the number of tropical cyclones that form in the vicinity of this ridge location. In fact, this ridge was previously identified by Donguy and Meyers (1995) in surface dynamic heights on annual time scales.
Gopalakrishna (1998) also identified similar relation between the available heat content in the upper Bay of Bengal and the number of cyclones that form in the vicinity of eastern Bay of Bengal. Rao et al., (2002b), using XBT data and OGCM results, showed that the SST in the Bay of Bengal is de-coupled from the subsurface ocean dynamics on interannual timescales (Fig 4), due to permanent, low-salinity, highly stratified near-surface pool in the Bay of Bengal.
Figure 4. Correlation coefficient of monthly SST anomalies with sea surface height anomalies during 1993 to 1999. The regions with weak correlations highlight the areas where salinity controls the stratification and decouples the subsurface dynamics from the surface.
Regional studies
Under the Indian XBT program, case studies are undertaken to examine the response of the upper ocean to the forcing of cyclonic storms of varying intensities in the Bay of Bengal (Gopalakrishna et al.,1995). Meso-scale eddies are identified in the Bay using XBT data and TOPEX sea surface heights (Gopalan et al., 2000) and reported significant interannual variability. TThadathil et al (1998, 2002) studied the dependence of regional water masses (IO and Antarctic waters) on the XBT fall rate.
Scientific basis and plans for XBT network
From the above scientific achievements it is very clear that a good deal of basic understanding of the IO mechanisms, which is the primary basis for XBT network, is achieved from XBT data analysis together with the analysis of either numerical model simulations or historical data. The data collected by this XBT network has been assimilated into ocean data assimilation (ODA) products at University of Maryland, USA (SODA, Carton et al. (2000), Japan Meteorological Agency (JMA), Japan (ODA, Ogawa, 2002, personal communication) and National Institute of Geophysical & Volcanology (INGV), Italy (Masina, 2002, personal communication) and these assimilated data sets are the active datasets for several present and future studies (for example Rao et al., 2002c). Further, being identified that IO can give rise to it’s own coupled phenomenon (Saji. et al., 1999; Rao et al., 2002a,c) which can significantly influence the climate over other remote regions of the globe it is very important to develop predictive capabilitiespredict this of this phenomenon. Rao et al., (2002c) showed that the subsurface pre-conditions are very important for the initiation of IOD in the Indian Ocean. Therefore, regular monitoring of upper ocean thermal structure is very important for all the above reasons.
Though it is identified that salinity is a very important modulator for the ocean-atmosphere interaction (example Murtugudde et al., 2000; Rao et al 2002b) in the Indian Ocean its measurements are scantiest. Therefore, proper plans should be made to monitor salinity, at least surface salinity, along the XBT lines in the IO. It may be noted that, JMA and JAMSTEC have already started XCTD low density observations along IX09 and IX10. Even data assimilation efforts need surface salinity, which otherwise in error at many places because of the limited reliability of fresh water fluxes that drive the OGCMs. As is evident from Fig. 1 that many areas, particularly SIO is sparsely sampled compared to any other basin, therefore efforts should be made to improve the frequency of observations in the SIO and if possible some more XBT lines may be initiated. Several regional experiments such as Arabian Sea Monsoon Experiment (ARMEX), Bay of Bengal Process Studies (BOBPS) in the IO should be encouraged to sample regularly the regional seas. Recently, there is a clear shift in the orientation of physical oceanography studies, which is integrating into a more multi-disciplinary mode. Considering this shift, the observational network should also integrate into multi-disciplinary mode by collecting various other parameters such as "chlorophyll, nutrients, phytoplankton and PCO2". For the first time, India designed such a multi-disciplinary observational network and commencing shortly along Indian XBT lines on a regular basis.
References
- Ashok,K., Z.Guan and T.Yamagata, Impact if the Indian monsoon rainfall and ENSO. Geophys Res Lett., (in press, 2001)
- Carton, J.A., G.Chepurin, X.Cao, and B.Giese. A simple ocean data assimilation analysis of the global upper ocean 1950-1995. Part I: Methodology. J. Phys. Oceanogr., 30, 294-309, 2000.
- Donguy, J.R and Meyers Gary, Observations of geostrophic transport variability in the western tropical indian Ocean. Deep Sea Res I, 42, 1007-1028, 1995.
- Gopalakrishna. V.V., V.S.N.Murty, M.S.S.Sarma ., and J.S.Sastry. Thermal response of upper layers of Bay of Bengal to forcing of a severe cyclonic storm: A case study. Indian J. Marine Sci, 44,234-240, 1995.
- Gopalakrishna, V.V. Some studies on the thermal fields in the central Bay of Bengal. Ph.D thesis, Andhra University, 1998.
- Gopalan, A. K. S., V. V. Gopalakrishna, M.M.Ali and Rashmi Sharma. Detection of Bay of Bengal eddies from TOPEX and in situ observations. J. Mar. Res, 58, 721-734, 2000.
- Hanawa, K and H. Suga, A review on the subtropical mode water in the north Pacific (NPSTMW). In Biogeochemical processes and ocean fluxes in the western Pacific, H.Sakai and Y.Nozaki (Eds), Terra Science, Tokyo, 1995.
- Levitus, S and T.P.Boyer, World Ocean Atlas, Vol.4, Temperature, NOAA Atlas, NESDIS4, 1994.
- Masumoto, Y., and G.Meyers. Forced Rossby waves in the southern tropical Indian Ocean. J Geophys. Res, 103, 27589-27602, 1998.
- McCreary, J.P.,P.K.Kundu and R.L.Molinary, A numerical investigation of the dynamics, thermodynamics and mixed layer processes in the Indian Ocean. Prog. Oceanography, 31, 181-224, 1993.
- Meyers, G. Variation of Indonesian throughflow and the El Nino-Southern Oscillation. J. Geophys. Res, 101, 12255-12263, 1996.
- Meyers Gary., H.Phillips, N.R.Smith and J.Sprintal, Space and time scales for optimum interpol- aton of temperature – Tropical Pacific Ocean. Progress in Oceanography, 28, 189 – 218, 1991.
- Ming Feng and Meyers Gary, Interannual variability in the tropical indian Ocean: A two year time scale of Indian Ocean Dipole. (Submitted to Deep Sea Res, 2002)
- Murtugudde, R., and A.J.Busalacchi. Interannual variability of the dynamics and thermodynamics, and mixed layer processes in the in the Indian Ocean. J. Climate, 12, 2300-2326, 1999.
- Murty,V.S.N, M.S.S.Sarma, B .P. Lambata, V. V. Gopalakrishna, S. M. Pednekar, A. Suryachanra Rao, A. J. Luis, A.R.Kaka and L.V.G.Rao, Seasonal variability of upper layer geostrophic transport in the tropoical Indian Ocean during 1992–1996 along TOGA - I XBT tracklines. Deep Sea Res I, 47, 1569-1582, 2000.
- Pankajakshan.T., A .K. Ghosh and P. M. Muraleedharan. An evaluation of XBT depth equations for Indian Ocean. Deep Sea Res I, 45, 819-827, 1998.
- Pankajakshan.T., A.K.saran, V.V. Gopala Krishna, P.Vethamony, Nilesh.A., and Rick Bailey. XBT fall rate in waters of extreme temperature: A case study in the Antarctic Ocean. J. Atmospheric and Oceanic Tech, 19, 391-396, 2002.
- Rao S. A., S.K.Behra, Y.Masumoto and T.Yamagata. Interannual subsurface variability in the tropical Indian Ocean with special emphasis on the Indian Ocean Dipole. Deep Sea Res II, 49, 1549- 1572, 2002a.
- Rao, A.S, Rossby waves in the Bay of Bengal: observations and simulations, Ph.D dissertation, 109 pp, Andhra University, Visakhapatnam, India, 1998.
- Rao, S.A, Interannaul Rossby waves in the tropical Indian Ocean and their forcing mechanisms. (manuscript submitted to JGR, 2002C).
- Rao S.A., V.V.Gopalakrishna, S.R.Shetye and T.Yamagata. Why were cool SST anomalies absent in the Bay of Bengal during the 1997 Indian Ocean Di[pole Event. Geophys. Res. Letts, (2002b, in press).
- Saji, H.N., B.N.Goswamy, P. N. Vinayachandran and T.Yamaghata, A Dipole mode in the tropical Indian Ocean. Nature, 401, 360-363, 1999.
- Schott, F., and J.P.McCreary. The monsoon circulation of the Indian Ocean. Progress in Oceanography, 51, 1-124, 2001.
- Taft, B.A and W.S.Kessler, Variations of zonal currents in the central tropical Pacific during 1970 to 1987: sea level and dynamic height measurements. J. Geophys. Res, 96, 12599-12618, 1991.
- Webster, P.J., A.M.Moore, J.P.Loschnigg and R.R.Leben, Coupled ocean – atmosphere dynamics in the Indian Ocean during 1997-1998, Nature, 401, 356-360, 1999.
- Woodberry., K.E, M.E.Luther and J.J.O’Brien. The wind-driven seasonal circulation in the southern tropical Indian Ocean. J Geophys Res, 94, 17985-18002, 1989.
- Xie., S.P., H.Annamalai, F.A.Schott and J.P.McCreary.Structure and mechanisms of south Indian Ocean climate variability. J of Climate.,15,864-876, 2002.<
Acknowledgements:
We express our sincere gratitude to Dr.A.S.Rao, Institute for Global Change Research, FRSGC, Yokohma, Tokyo, Japan who helped in many ways. We thank Drs. Etienne Charpentier, Technical Coordinator, SOOP, Satoshi Ogawa (JMA) and Tadashi Ando (JAMSTEC) for providing several inputs.