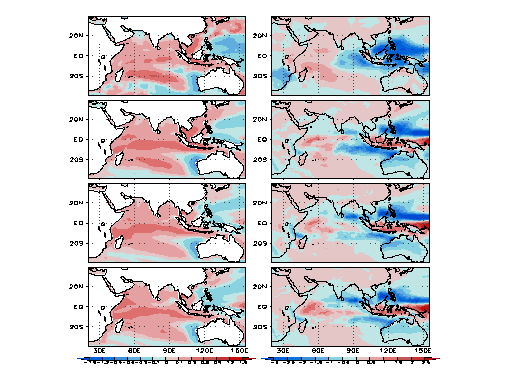
ENSO-related anomalies in the Indian Ocean (DJF):
Observed
3-month
lead
6-month
lead
9-month
lead
Composite
map
(El Nino –
La Nina)
El Nino:
1986/87
1991/92
1997/98
2002/03
La Nina:
1984/85
1988/89
1995/96
1999/2000
SSTA (ºC)
Precip. anom. (mm/day)
This shows SST and rainfall anomalies in the IO associated with ENSO in boreal winter. During El Nino, warm SST appears in the tropical IO basin, SW IO, and cold anomaly in WA. This pattern was predicted very well. For rainfall prediction, the model has systematic bias, particularly in Indonesia region. The drought in Australia is too strong in the model. The  dipole pattern in the IO (less rainfall in the east and floods in the west) can be predicted basically.