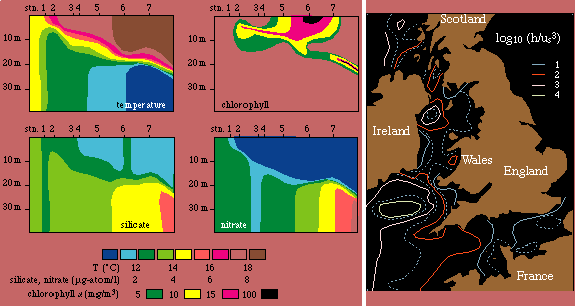
 A section through a shallow sea front, showing
temperature, chlorophyll-a, silicate and nitrate. The diagram on the right shows
the logarithm of the water depth h divided by the cube of the peak tidal
velocity u at the surface, log10(h/u3).
Shallow sea fronts are located where the value
of this quantity is approximately 2.5 (between the pink and red contours).
The front shown in the diagrams on the left is the one seen off the coast of
France. Figure 9.10 shows the front
in the Irish Sea. A
satellite image
of the region shows the frontal
locations as thermal fronts. Adapted from Simpson and Pingree (1978).
© 1996 M. Tomczak
contact address: