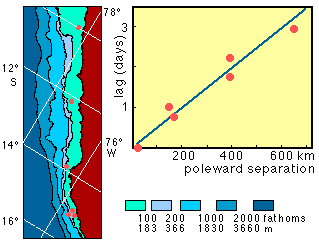
Evidence of Kelvin waves along the coast of Peru. The shelf of South America is very narrow and the shelf edge very steep, particularly in the south.
Currents were measured for periods of several months at the locations shown as red dots on the map. The data were low-pass filtered to eliminate tides and other variations with periods less than one day.
The filtered data from different stations were then compared with each other using cross correlation analysis. It was found that the data compared best when the time series from different stations were shifted ("lagged") against each other in time. The right diagram shows the lags obtained for the best comparison (highest correlation), relative to the northernmost station at 10°S. The regular increase of the lag for the highest correlation indicates that a variation of the current speed observed at that station travels southward along the coast with a speed of about 200 km/day.
Adapted from Smith (1978)
contact address: