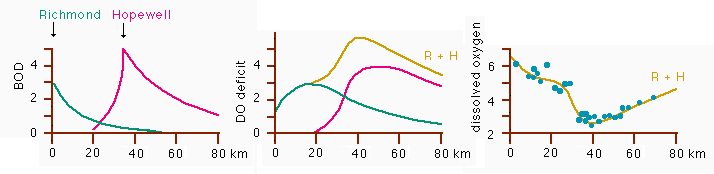
 An example of a coupled non-conservative system of pollutants. Two sewage outfalls, Richmond and Hopewell, are located on an estuary some 40 km apart. Their associated pollution profile, expressed in mg/l BOD, is shown in the first figure. The second figure shows the resulting DO deficit for each outfall and for the sum of both. The observed oxygen levels are shown as points in the last figure, together with the dissolved oxygen distribution derived from the DO deficit curve. Note that in the vicinity of the Hopewell outfall oxygen levels fall below 3 mg/l, just marginally sufficient to sustain life in that part of the estuary.
Unit for all figures: mg/l.
© 2000 M. Tomczak
contact address: