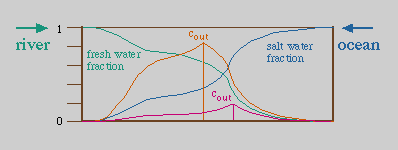
 Sketch diagram for the distribution of conservative pollutants in an estuary. The salt water fraction and fresh water fraction are shown by thin curves. Two examples of conservative pollutant distributions are shown. The outlets are at the vertical lines, where the initial concentrations are given by their respective values of cout. The concentrations downstream from the outlet are proportional to the fresh water fraction, the concentrations upstream are proportional to the salt water fraction.
© 2000 M. Tomczak
contact address: