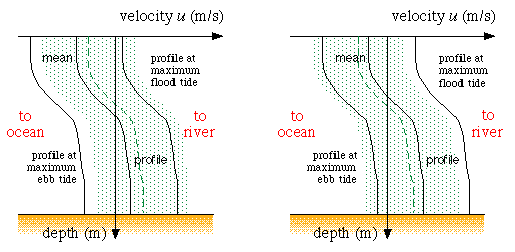
 Sketch of velocity profiles in a three dimensional estuary. Looking towards the sea in the northern (southern) hemisphere, the left figure shows velocity profiles for the right (left) bank and the right figure shows velocity profiles for the left (right) bank. The broken lines give the mean velocity profile for the section across the estuary; the shading indicates the range between maximum ebb and flood tide averaged across the section.
© 1996 M. Tomczak
contact address: