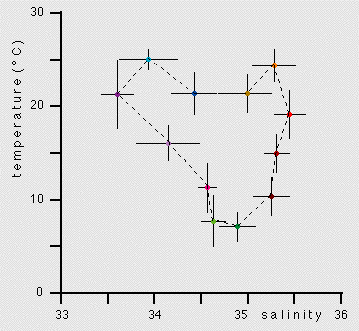
 Sketch of a TS-time diagram based on
monthly mean temperatures and salinities and associated
standard deviations. The sketch is loosely based on the sample data of Figure 10.2; monthly water types (dots) and standard deviations are representative of those observations.
A coastal water mass can be defined through the 12 monthly water types and their standard deviations, connected in an annual cycle through the broken line.
© 2000 M. Tomczak
contact address: