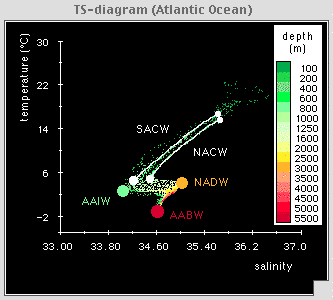
 Water masses of the deep ocean as seen in a
TS-diagram and associated source water types. The figure is a typical example of a
TS-diagram for the deep ocean, in which temperature is
plotted against salinity as a function of depth. It is based
on observations from the western basins of the South Atlantic Ocean. Approximate depths are indicated by colours.
- AABW = Antarctic Bottom Water
- NADW = North Atlantic Deep Water
- AAIW = Antarctic Intermediate Water
- SACW = South Atlantic Central Water
- NACW= North Atlantic Central Water
AABW, NADW and AAIW are water masses identified by a single water type and standard deviation. (The actual standard deviation observed in the data is much less than the size of the dots shown here.)
SACW and NADW are water masses identifed by a sequence of water types arranged along a line; only the end points are shown as dots. The standard deviations for SACW and NACW can be estimated by the range of data scatter around the lines.
Small coloured dots represent individual observations from the corresponding depth. Note that most observations cluster around lines that connect the water types, indicating various degrees of mixing between them.
© 2000 M. Tomczak
contact address: