

scale - data comments - contents list
Drag the frame borders to resize image areas as required.
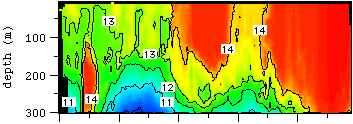
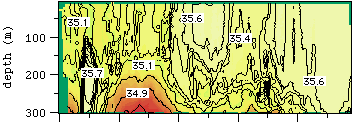
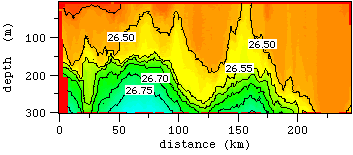
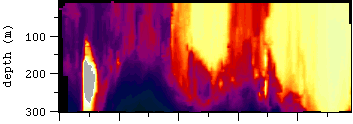
Note: To allow easy comparison between different legs the above images use the same colour scheme as all other figures. Another representation of the salinity field which highlights the large gradients and the similarity with the temperature field is shown below (top: temperature; middle: salinity; bottom: salinity with isohalines).


