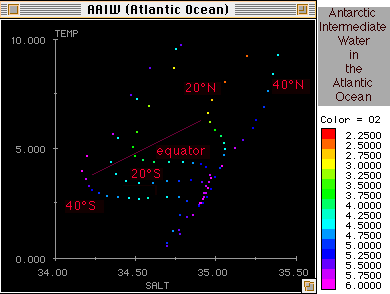
 A series of TS-diagrams from
the Atlantic Ocean, from 40°S to 40°N, showing the
erosion of the salinity minimum associated with
Antarctic Intermediate Water along the path of the water
mass. The red line traces the salinity minimum produced by the relatively
fresh Antarctic Intermediate Water.
A series of TS-diagrams from
the Atlantic Ocean, from 40°S to 40°N, showing the
erosion of the salinity minimum associated with
Antarctic Intermediate Water along the path of the water
mass. The red line traces the salinity minimum produced by the relatively
fresh Antarctic Intermediate Water.Colour indicates oxygen content. Note how the oxygen content associated with the salinity minimum decreases from south to north, indicating the aging of the Antarctic Intermediate Water.
contact address: