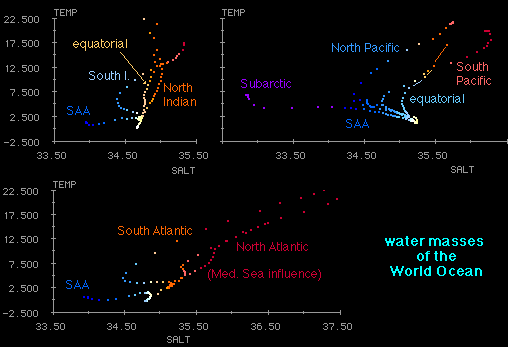

TS-diagrams of the Indian, Pacific and Atlantic Oceans showing the TS properties of the major water masses. Colour indicates salinity; the information is the same as given on the horizontal axis but helps to compare the three oceans.
All TS-diagrams "fan out" from a point below 0°C and a salinity of about 35.6 (white). This is Antarctic Bottom Water, found in all oceans. At higher temperatures the shape of the TS-diagrams (ie the TS-properties of the ocean) depend on the ocean region. In the Subantarctic zone (SAA) (south of 45°S) temperatures remain low and salinities decrease. The same is seen in the Subartic zone (north of 45°N). The influence of high salinity inflow from the Mediterranean Sea is seen by higher salinities near 8 - 10°C in the North Atlantic Ocean. The influence of high salinity outflow from the Red Sea raises the salinities in the North Indian Ocean.
contact address: