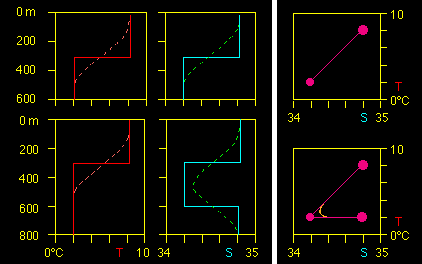

Examples of temperature-salinity (TS)-diagrams. The diagrams on the left show the distribution of temperature (red) and salinity (cyan) with depth; the diagrams on the right show the corresponding TS-diagrams. Top: layering of a warm and saline water mass found at 0 - 300 m depth above a cold and fresh water mass found at 300 - 600 m. The full lines show the situation before mixing, the broken lines after mixing. The TS-diagram shows the two water masses as TS points. Before mixing only the two points are seen in the TS-diagram. Mixing connects the two TS-points by a straight line.
Bottom: layering of three water masses (intrusion of a low salinity water mass at 300 - 600 m depth). Again, the full lines show the situation before mixing, the broken lines after mixing. The TS- diagram shows two mixing lines; the erosion of the intermediate salinity minimum by mixing is seen by the departure of the broken curve from the original water mass point.
contact address: