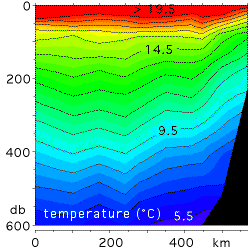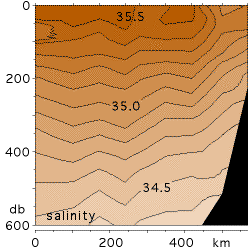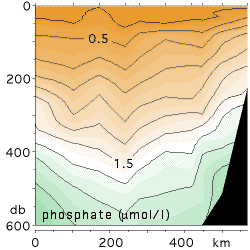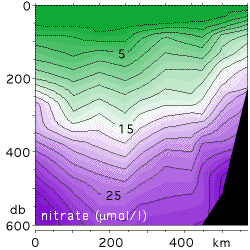


Water property sections in a coastal upwelling region, indicating upward water movement within about 200 km from the coast. (This particular example comes from the Benguela Current upwelling region, off the coast of Namibia.) The coast is on the right, outside the graphs; the edge of the shelf can just be seen rising to about 200 m depth at the right of each graph.
Note how all contours rise towards the surface as the coast is approached; they rise steeply in the last 200 km. On the shelf the water is colder, less saline and richer in nutrients as a result of upwelling.
contact address: