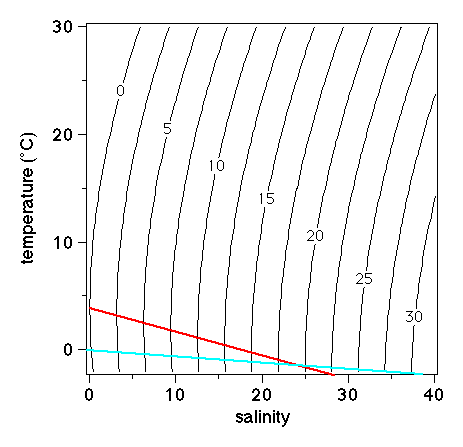
 Density σt as a function of temperature and salinity for the salinity range from
freshwater to extreme oceanic salinities. The temperature of the density
maximum is shown as a red line, the freezing point is shown as a light
blue line.
Density σt as a function of temperature and salinity for the salinity range from
freshwater to extreme oceanic salinities. The temperature of the density
maximum is shown as a red line, the freezing point is shown as a light
blue line.contact address