 Observations of a first order seiche in the Baltic Sea.
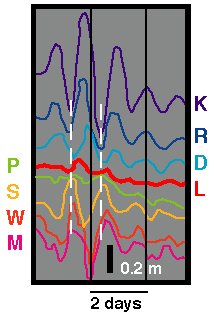
First diagram: Observed water level variations at Koivisto (K), Reval (R), Domesnaes (D), Libau (L), Pillau (P), Stolpmünde (S), Warnemünde (W) and Marienleuchte (M). The broken white lines indicate the period of the seiche (slightly more than 1 day). The black bar gives the vertical scale.
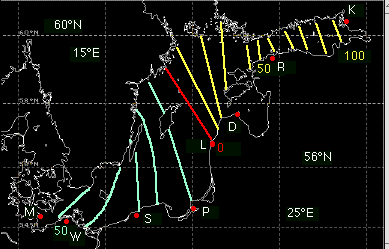
Second diagram: Observed wave amplitude. Contour interval is 10 cm. Note the node at Libau (indicated by the red zero contour). At locations in the yellow contoured region the seiche is in the opposite phase to locations in the aqua-green contoured regions. The same phase relationship can be seen in the left diagram by comparing, for example, the records of Koivisto and Reval with the record of Stolpmünde.
contact address: