|
Now we look at another point in the TS-diagram relate to observations in space. 
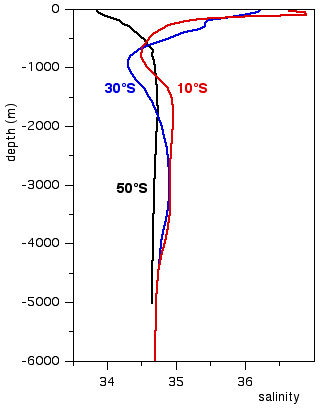
This time the arrow points to a maximum in the salinity. Can you identify the maximum at 10°S in the vertical salinity profiles? Click on the maximum in the corresponding profile. If you need help, click here. |

|