|
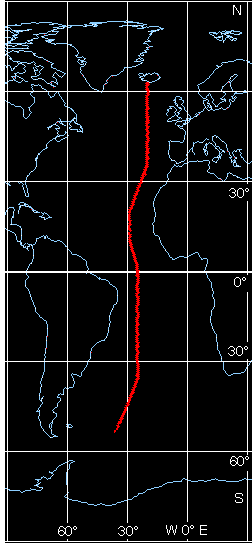
This exercise looks at the water masses of the deep ocean. It is the first in this series of exercises which is by neccessity entirely based on oceanographic observations. Most pages of the exercise are based on data collected along the meridional section in the Atlantic Ocean shown on the right.

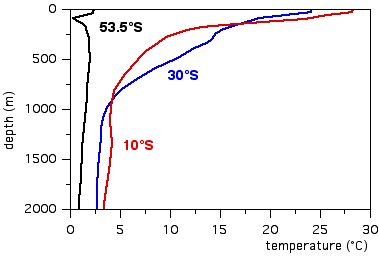
This diagram shows how temperature varies with depth at three locations: in the polar region (at 53.5°S), in the subtropics (30°S), and in the tropics (10°S). (Similar temperature profiles are obtained at locations in the northern hemipshere.)
Features to note are:
|
 |