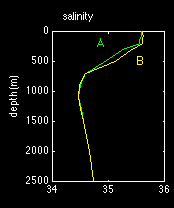

The salinity distribution shows the familiar salinity minimum in the vicinity of 1000 m produced by the Antarctic Intermediate Water. (See Exercise 4 if you are not familiar with this water mass.) Below 1000 m salinity increases again, indicating the presence of Circumpolar Water.
 |
depth (m) | S at A | S at B |
| 0 20 50 75 100 150 200 300 500 700 900 1100 1300 1500 2000 2500 |
35.590 35.590 35.590 35.598 35.574 35.562 35.551 35.249 34.932 34.592 34.492 34.470 34.509 34.562 34.667 34.725 |
35.612 35.614 35.615 35.617 35.613 35.614 35.607 35.403 35.106 34.588 34.488 34.466 34.506 34.560 34.665 34.725 |
Note that the salinity at station A is lower than the salinity at station B at depths less than about 500 m but higher in the depth range 500 - 1000 m. How does this affect the density difference between both stations?
activate display window for
temperature