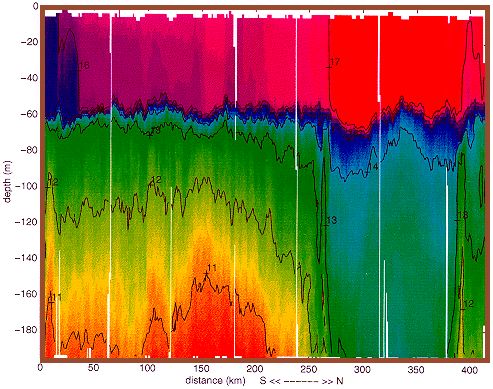
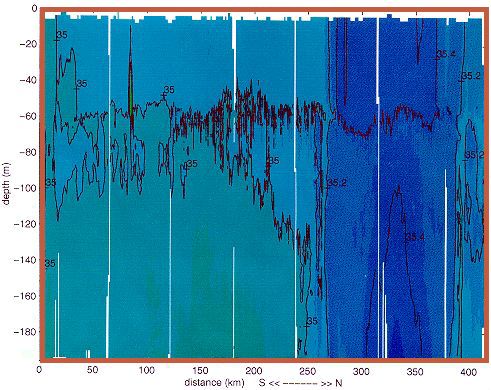
The meandering STF is crossed twice, near km 270 and km 380. The warm and salty water between km 270 - 380 is the region on the subtropical (northern) side of the front, the remainder the subpolar (southern) region. Note the high salinity features below the mixed layer which trail away from the subtropical into the subpolar region. They are believed to be remnants of temporary interleaving, produced by variable winds which shift the mixed layer back and forth across the front.
© 1998 M. Tomczak
contact address: